Pawsitive Placements: Enhancing Animal Welfare through Data Analysis#
Authors: Florence Thin, Michelle Lin, and Sarah Song
Introduction#
Animal adoption in shelters play a vital role in providing loving homes for animals in need while benefiting both the adopters and the community. By choosing to adopt from shelters, individuals offer animals a second chance at life, providing them with care, love, and security. Beyond the individual act of adoption, the benefits extend to the community as well. Adoption reduces the strain on overcrowded shelters, allowing them to allocate resources effectively and rescue more animals. In our project focused on Sonoma County Animal Services, we aim to analyze adoption outcomes and identify factors that contribute to successful placements.
In this overview notebook, we will go provide a background on the project, as well as present the results from our EDA and modeling. Individual notebooks with detailed code for both the EDA and modeling sections can be found on this website as well.
Goal of Analysis#
Through our analysis, we hope to shed insight on the outcomes of animals surrendered to Sonoma County Animal Services. Through careful analysis of adoption outcomes, our project aims to enhance animal welfare by identifying the factors that contribute to successful adoptions. This analysis will enable us to uncover patterns and trends that correlate with higher adoption rates, allowing us to develop effective strategies for increasing successful placements for these animals. By doing so, we hope to make a positive impact and improve the overall welfare of animals in need.
About the Data#
We retrieved the data from SoCo Data, which is an open data portal for the County of Sonoma. Here is a link to the data: https://data.sonomacounty.ca.gov/Government/Animal-Shelter-Intake-and-Outcome/924a-vesw
Our main assumption from this data is that it is a comprehensive collection of all animals that the Sonoma County Animal Services worked with. Otherwise, our results would not be applicable to real-life scenarios, and our models would not be trained on accurate data. Additionally, in order to apply our findings to other geographical locations, we rely on the assumption that the data we used can be generalized to areas other than Sonoma County. This may not necessarily be true, as differences such as population density and income may affect animal outcomes.
import numpy as np
import pandas as pd
from IPython.display import Image
import pickle
shelter_data = pd.read_csv('./data/Animal_Shelter_Data.csv')
shelter_data.shape
(25008, 24)
shelter_data.head(5)
| Name | Type | Breed | Color | Sex | Size | Date Of Birth | Impound Number | Kennel Number | Animal ID | ... | Intake Subtype | Outcome Type | Outcome Subtype | Intake Condition | Outcome Condition | Intake Jurisdiction | Outcome Jurisdiction | Outcome Zip Code | Location | Count | |
|---|---|---|---|---|---|---|---|---|---|---|---|---|---|---|---|---|---|---|---|---|---|
| 0 | RAZOR | DOG | BOSTON TERRIER | BLACK/WHITE | Neutered | SMALL | 10/29/2009 | K22-043412 | TRUCK | A396382 | ... | FIELD | RETURN TO OWNER | FLD_IDTAG | UNKNOWN | HEALTHY | SANTA ROSA | SANTA ROSA | 95404.0 | 95404(38.43807, -122.71247) | 1 |
| 1 | NaN | OTHER | PIGEON | GRAY/WHITE | Unknown | SMALL | NaN | K23-044095 | TRUCK | A416206 | ... | FIELD | EUTHANIZE | INJ SEVERE | UNKNOWN | HEALTHY | SANTA ROSA | NaN | NaN | NaN | 1 |
| 2 | MAX | DOG | BORDER COLLIE | BLACK/TRICOLOR | Neutered | MED | 03/10/2020 | K23-044090 | DS80 | A399488 | ... | FIELD | RETURN TO OWNER | OVER THE COUNTER_CALL | UNKNOWN | PENDING | COUNTY | COUNTY | 95472.0 | 95472(38.40179, -122.82512) | 1 |
| 3 | NaN | CAT | DOMESTIC LH | GRAY/WHITE | Spayed | SMALL | 06/26/2011 | K22-043405 | VET | A414520 | ... | FIELD | DISPOSAL | DOA | UNKNOWN | DEAD | COUNTY | SANTA ROSA | 95403.0 | 95403(38.51311, -122.75502) | 1 |
| 4 | PUDGY | DOG | CHIHUAHUA SH/SCHIPPERKE | TAN | Neutered | MED | 07/20/2013 | K23-043813 | DA27 | A415428 | ... | OVER THE COUNTER | TRANSFER | MUTTVILLE | UNKNOWN | HEALTHY | SANTA ROSA | OUT OF COUNTY | 94103.0 | 94103(37.77672, -122.40779) | 1 |
5 rows × 24 columns
shelter_data.columns
Index(['Name', 'Type', 'Breed', 'Color', 'Sex', 'Size', 'Date Of Birth',
       'Impound Number', 'Kennel Number', 'Animal ID', 'Intake Date',
       'Outcome Date', 'Days in Shelter', 'Intake Type', 'Intake Subtype',
       'Outcome Type', 'Outcome Subtype', 'Intake Condition',
       'Outcome Condition', 'Intake Jurisdiction', 'Outcome Jurisdiction',
       'Outcome Zip Code', 'Location', 'Count'],
      dtype='object')
Data Exploration#
Number of Animals in the Shelter by Type#
To generate this table, we created the function number_of_animals_by_type for the sheltertools package. It calculates the number of animals per Intake Type.
with open('computation_results/' + 'animal_types.pickle', 'rb') as f:
    animal_types = pickle.load(f)
animal_types
Intake Type      Type
ADOPTION RETURN  DOG        292
                 CAT        116
                 OTHER        4
BORN HERE        CAT         16
                 OTHER        1
CONFISCATE       DOG       1456
                 CAT        245
                 OTHER      197
OS APPT          DOG          1
OWNER SURRENDER  CAT       1595
                 DOG       1414
                 OTHER      143
QUARANTINE       DOG        424
                 OTHER      277
                 CAT        118
STRAY            DOG      10223
                 CAT       6603
                 OTHER     1417
TRANSFER         DOG        258
                 CAT        161
                 OTHER       12
Name: Type, dtype: int64
Top Breeds by Animal Type#
For these bar charts, we created the function plot_top_breeds for the sheltertools package. It plots the top breeds for a specified animal type.
Top Cat Breeds#
Image(filename = 'figures/CAT_in_the_Shelter.png', width=800, height=800)
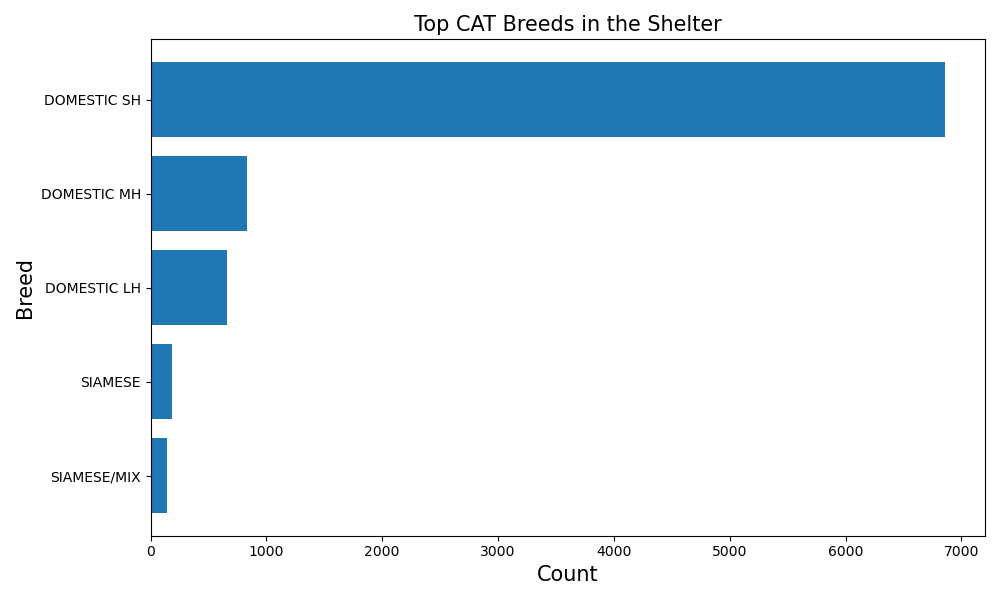
Our analysis reveals that the dominant cat breeds at Sonoma County Animal Shelter are domestic short hair cats. This observation aligns with the geographic context of Sonoma County being situated in California, a region characterized by warm climates. The prevalence of domestic short hair cats can be attributed to their inherent ability to adapt and thrive in such conditions.
Top Dog Breeds#
Image(filename = 'figures/DOG_in_the_Shelter.png', width=800, height=800)
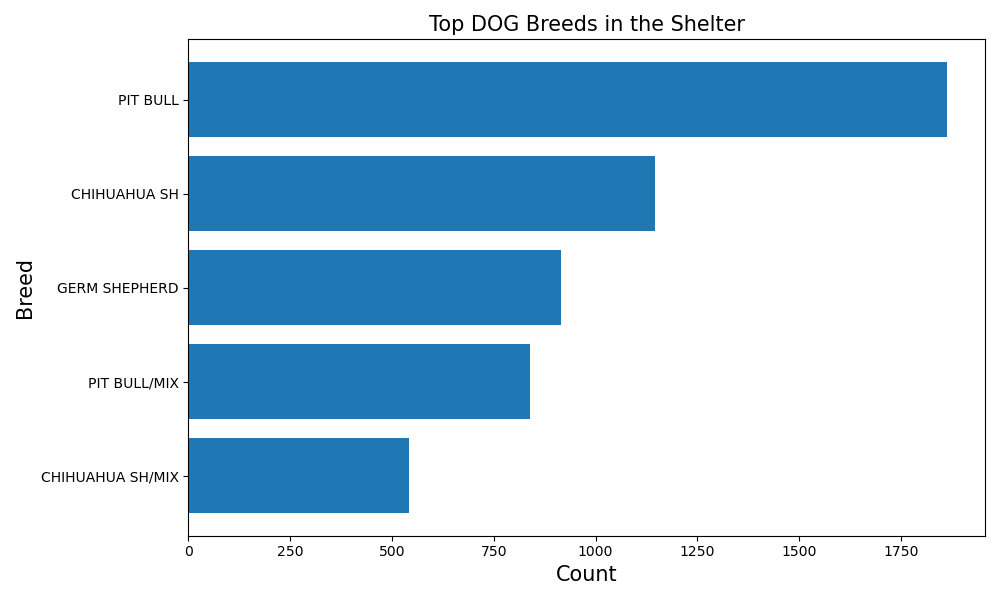
According to our analysis, the Pit Bull breed appears to be prominently represented at the Sonoma County Animal Shelter. This observation can be influenced by the perceptions and biases associated with this breed. Pit bulls have historically encountered challenges and misconceptions due to their past associations with activities like dogfighting.
Trend Line: which year has the most number of animal intakes?#
For this plot, we used the function plot_trend_line, which we wrote for the sheltertools package. It plots the count of animals by year.
Image(filename = 'figures/Trend_Line_of_Animal_Intakes_by_Year.png', width=800, height=800)
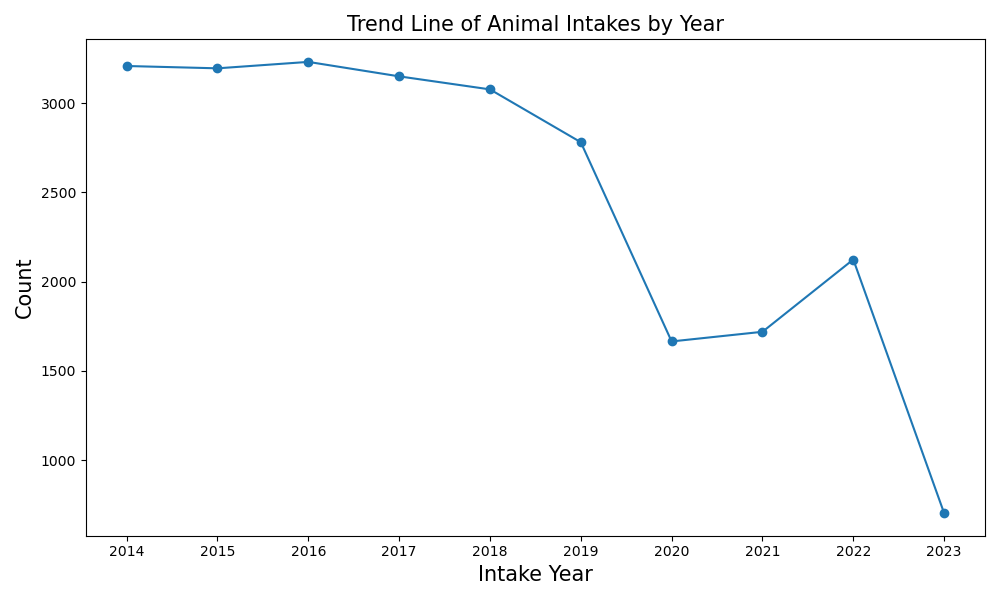
The trend line analysis reveals a gradual decrease in animal intakes from 2014 to 2019, followed by a significant drop in 2020, with the count decreasing from approximately 2500 to 1700. This sharp decline can be attributed to the onset of the COVID-19 pandemic when quarantine measures were implemented, resulting in fewer animals being brought to the shelter. However, there has been a revival in intakes from 2021 to 2022, with the count increasing from around 1750 to 2200. This rise may be associated with the overall improvement in the pandemic situation as more individuals received vaccinations, leading to a decrease in COVID-19 transmission rates and restrictions. It is important to note that the dataset only includes information up until early 2023, hence the low count of animal intakes for that year. Further data beyond 2023 will provide updated insights once available.
Outcomes By Species#
The number of animals categorized by shelter intake type:
with open('computation_results/' + 'animal_types.pickle', 'rb') as f:
    intake_data = pickle.load(f)
intake_data
Intake Type      Type
ADOPTION RETURN  DOG        292
                 CAT        116
                 OTHER        4
BORN HERE        CAT         16
                 OTHER        1
CONFISCATE       DOG       1456
                 CAT        245
                 OTHER      197
OS APPT          DOG          1
OWNER SURRENDER  CAT       1595
                 DOG       1414
                 OTHER      143
QUARANTINE       DOG        424
                 OTHER      277
                 CAT        118
STRAY            DOG      10223
                 CAT       6603
                 OTHER     1417
TRANSFER         DOG        258
                 CAT        161
                 OTHER       12
Name: Type, dtype: int64
The proportion of animal types within each outcome type:
with open('computation_results/' + 'top_outcome.pickle', 'rb') as f:
    top_outcome = pickle.load(f)
top_outcome
| percent | ||
|---|---|---|
| Type | Outcome Type | |
| OTHER | TRANSFER | 42.793682 |
| EUTHANIZE | 21.816387 | |
| ADOPTION | 21.273445 | |
| RETURN TO OWNER | 9.871668 | |
| DIED | 2.270484 | |
| DISPOSAL | 1.727542 | |
| ESCAPED/STOLEN | 0.246792 | |
| DOG | RETURN TO OWNER | 50.250609 |
| ADOPTION | 23.600172 | |
| TRANSFER | 14.556781 | |
| EUTHANIZE | 10.826292 | |
| RTOS | 0.264929 | |
| DISPOSAL | 0.250609 | |
| DIED | 0.214807 | |
| ESCAPED/STOLEN | 0.035801 | |
| CAT | ADOPTION | 40.948276 |
| TRANSFER | 26.576679 | |
| EUTHANIZE | 16.254537 | |
| RETURN TO OWNER | 13.214610 | |
| DISPOSAL | 1.780853 | |
| DIED | 1.020871 | |
| RTOS | 0.124773 | |
| ESCAPED/STOLEN | 0.079401 |
Image(filename = 'figures/Proportion_of_Outcome_Within_Each_Species.png', width=800, height=800)
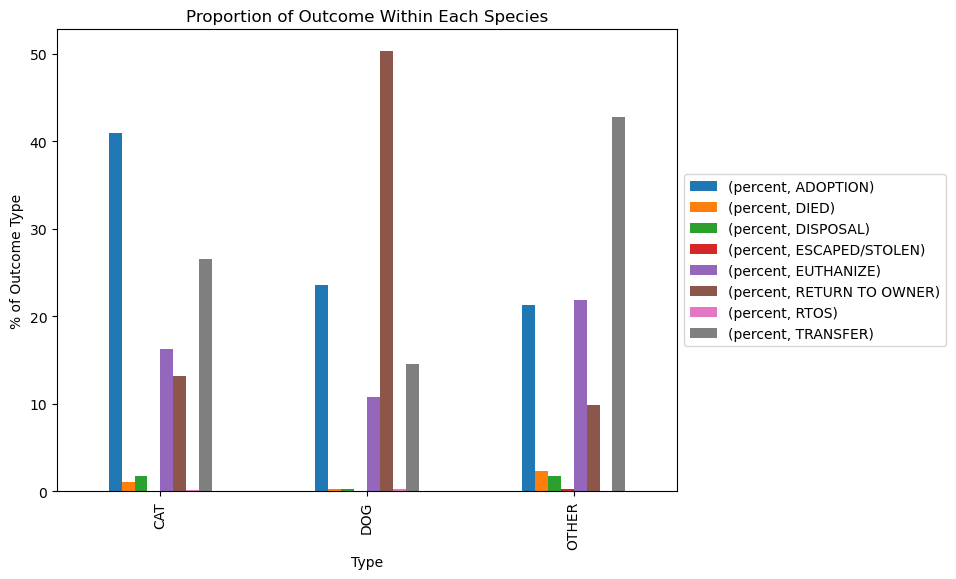
Adoption was the most common outcome for cats at 41%. Half of the dogs in the shelter are being returned to owner, whereas most of the other species (43%) are being transferred.
Shelter Performance#
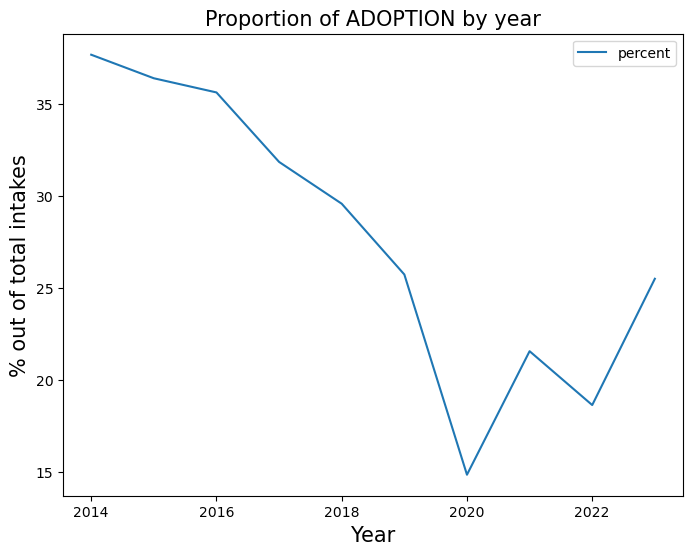
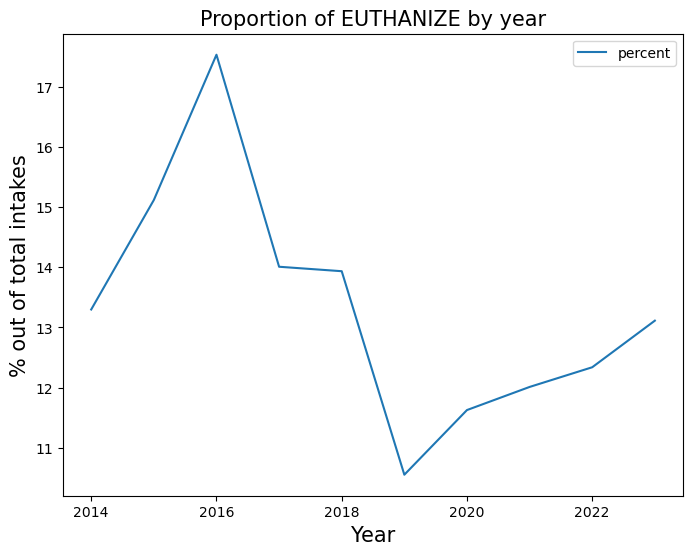
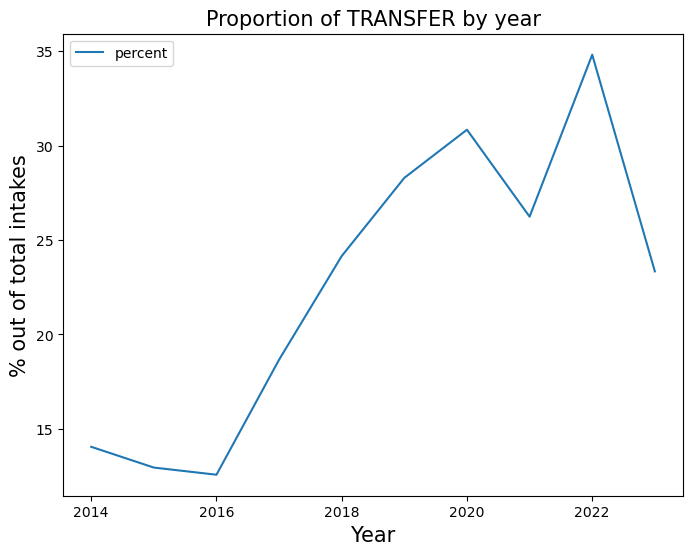
In this section, we display shelter performance based on Adoption rate, Transfer rate, Return-to-owner rate, and Euthanasia Rate.
The overall rates for each species and outcome type throughout all years:
with open('computation_results/' + 'rates_df.pickle', 'rb') as f:
    rates_by_outcome = pickle.load(f)
rates_by_outcome
| percent | ||||||||
|---|---|---|---|---|---|---|---|---|
| Outcome Type | ADOPTION | DIED | DISPOSAL | ESCAPED/STOLEN | EUTHANIZE | RETURN TO OWNER | RTOS | TRANSFER |
| Type | ||||||||
| CAT | 40.948276 | 1.020871 | 1.780853 | 0.079401 | 16.254537 | 13.214610 | 0.124773 | 26.576679 |
| DOG | 23.600172 | 0.214807 | 0.250609 | 0.035801 | 10.826292 | 50.250609 | 0.264929 | 14.556781 |
| OTHER | 21.273445 | 2.270484 | 1.727542 | 0.246792 | 21.816387 | 9.871668 | NaN | 42.793682 |
Image(filename = 'figures/Proportion_of_ADOPTION_by_Year.png', width=600, height=600)
Image(filename = 'figures/Proportion_of_EUTHANIZE_by_Year.png', width=600, height=600)
Image(filename = 'figures/Proportion_of_TRANSFER_by_Year.png', width=600, height=600)
Image(filename = 'figures/Proportion_of_RETURN TO OWNER_by_Year.png', width=600, height=600)
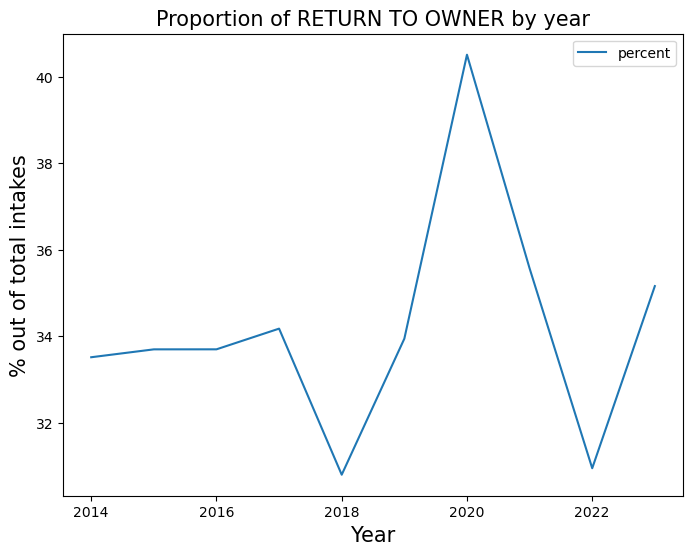
Upon analyzing the above graphs, it is evident that both the adoption rates and euthanize rates exhibit a declining trend over the years, which aligns with our previous assumption regarding the onset of the COVID-19 pandemic. Specifically, the proportion of adoptions reached its lowest peak in 2020, accounting for approximately 15% of the outcomes, while the proportion of euthanizations hit its lowest peak in 2019, representing around 6% of the outcomes. These two years were heavily influenced by the impact of COVID-19. Conversely, the proportion of animal transfers to other shelters displayed an increasing trend over the years and reached its highest peak in 2022, comprising approximately 35% of the outcomes. Additionally, the proportion of animals returned to their owners reached its highest peak in 2020, accounting for around 41% of the outcomes.
Modeling#
Our code and plots for this section can be found in our modeling notebook, which has its own page titled “Statistical Models.”
Will this Animal be Adopted?#
We employed logistic regression models to examine the likelihood of an animal being adopted. The aim of this analysis was to develop a predictive model that could be utilized to identify animals with a lower probability of adoption, allowing for prioritized efforts to optimize euthanize rates at the shelter. The model utilized input features such as animal types, sex, size, intake type, and intake condition. The performance of our model was respectable, achieving an accuracy of 83%, a true positive rate (TPR) of 63%, a false positive rate (FPR) of 9%, and a receiver operating characteristic area under the curve (ROC-AUC) score of 0.91. In the future, we intend to enhance the model by incorporating additional potential features and further investigate the factors that contribute to the challenges faced by certain animals in finding adoptive homes.
How Many Days Before Adoption?#
We employed the CatBoost machine learning algorithm to predict the number of days before adoption, but unfortunately, the model did not yield satisfactory results. Despite transforming the target values to address the exponential distribution, the model’s performance remained subpar. The root mean squared error (RMSE) for the predictions was 22.6 days, and the R-squared value, which measures the goodness of fit, was relatively low at 0.36.
However, the feature importances provided by CatBoost proved to be valuable. This revealed that Age and Intake Year were the top two most influential features in the regression analysis. These insights highlight the importance of considering the age of the animals and the year they were taken into the shelter when predicting the time to adoption.
Conclusions#
Through our EDA and modeling, we were able to provide some insight on the outcomes of animals surrendered to Sonoma County Animal Services. We identified factors that contributed to successful adoptions, such as the age of the animal, as well as other factors that influence whether an animal is ultimately adopted or not. This will help shelters determine what factors to prioritize when determining whether not an animal should be kept for adoption or euthanized, which is an unfortunate reality that shelters must face. But by providing these insights, we hope to increase successful placements for these animals and minimizing in-shelter time, thus maximizing the number of animals that shelters are ultimately able to help find new homes, and generally increasing the overall welfare of animals in need.

