
Less-than-four-year Retention Rates#
import matplotlib.pyplot as plt
import matplotlib as mpl
import numpy as np
import seaborn as sns
import pandas as pd
import scipy.stats as stats

from tools.utils import filtered_df_two_columns, pearson_corr_coef, prediction_analysis, regression_analysis_results, calculate_MSE
data = pd.read_csv("data/Most-Recent-Cohorts-Institution-filtered.csv").drop('Unnamed: 0', axis=1)
Racial and Ethnic Diversity Analysis#
race_columns = ['UGDS_WHITE', 'UGDS_BLACK', 'UGDS_HISP', 'UGDS_ASIAN',
                'UGDS_AIAN', 'UGDS_NHPI', 'UGDS_2MOR', 'UGDS_NRA', 'UGDS_UNKN']
data[race_columns]
| UGDS_WHITE | UGDS_BLACK | UGDS_HISP | UGDS_ASIAN | UGDS_AIAN | UGDS_NHPI | UGDS_2MOR | UGDS_NRA | UGDS_UNKN | |
|---|---|---|---|---|---|---|---|---|---|
| 0 | 0.0159 | 0.9022 | 0.0116 | 0.0012 | 0.0028 | 0.0008 | 0.0143 | 0.0073 | 0.0440 |
| 1 | 0.5496 | 0.2401 | 0.0610 | 0.0704 | 0.0024 | 0.0004 | 0.0469 | 0.0232 | 0.0059 |
| 2 | 0.2550 | 0.6913 | 0.0268 | 0.0034 | 0.0000 | 0.0000 | 0.0000 | 0.0000 | 0.0235 |
| 3 | 0.7173 | 0.0907 | 0.0599 | 0.0354 | 0.0083 | 0.0010 | 0.0431 | 0.0190 | 0.0252 |
| 4 | 0.0167 | 0.9265 | 0.0130 | 0.0019 | 0.0017 | 0.0017 | 0.0119 | 0.0155 | 0.0111 |
| ... | ... | ... | ... | ... | ... | ... | ... | ... | ... |
| 6676 | NaN | NaN | NaN | NaN | NaN | NaN | NaN | NaN | NaN |
| 6677 | NaN | NaN | NaN | NaN | NaN | NaN | NaN | NaN | NaN |
| 6678 | NaN | NaN | NaN | NaN | NaN | NaN | NaN | NaN | NaN |
| 6679 | NaN | NaN | NaN | NaN | NaN | NaN | NaN | NaN | NaN |
| 6680 | NaN | NaN | NaN | NaN | NaN | NaN | NaN | NaN | NaN |
6681 rows × 9 columns
These columns provide information on the racial and ethnic diversity of undergraduate, degree-seeking students in a particular institutions.
white (UGDS_WHITE)
black (UGDS_BLACK)
Hispanic (UGDS_HISP)
Asian (UGDS_ASIAN)
American Indian/Alaska Native (UGDS_AIAN)
Native Hawaiian/Pacific Islander (UGDS_NHPI)
two or more races (UGDS_2MOR)
non-resident aliens (UGDS_NRA)
unknown (UGDS_UNKN)
We will be using the Simpson’s Diversity Index to describe the Racial and Ethnic diversity of professions schools in the United States.
data['diversity_index'] = 1 - data[race_columns].apply(lambda row: row**2, axis=1).sum(axis=1)
data['diversity_index']
0       0.183444
1       0.628836
2       0.455797
3       0.469490
4       0.140635
          ...
6676    1.000000
6677    1.000000
6678    1.000000
6679    1.000000
6680    1.000000
Name: diversity_index, Length: 6681, dtype: float64
FTL4_institutions = data[data['RET_FTL4'].notnull()][['diversity_index', 'RET_FTL4']]
FTL4_institutions.head()
| diversity_index | RET_FTL4 | |
|---|---|---|
| 6 | 0.430426 | 0.5915 |
| 11 | 0.661073 | 0.5538 |
| 13 | 0.588972 | 0.5961 |
| 14 | 0.527717 | 0.5449 |
| 16 | 0.478832 | 0.5357 |
# less-than-four-year institutions
print(FTL4_institutions['RET_FTL4'].mean(), FTL4_institutions['diversity_index'].mean())
0.6909051969012266 0.47995730161071665
\(H_0:\) There is no relationship between the retension rate and diversity index at less-than-four-year institutions.
\(H_1:\) There is no relationship between the retension rate and diversity index at less-than-four-year institutions.
corr, p_value = stats.pearsonr(FTL4_institutions['diversity_index'], FTL4_institutions['RET_FTL4'])
print(corr, p_value)
-0.08259689032835084 4.15791895176101e-06
g = sns.jointplot(data=FTL4_institutions, x='diversity_index', y='RET_FTL4', kind='kde', fill='b')
g.ax_joint.annotate(f'corr: {corr:.2f}, p-value: {p_value:.2e}', xy=(0,1.1))
plt.savefig('figures/RET_FTL4_diversity.png');
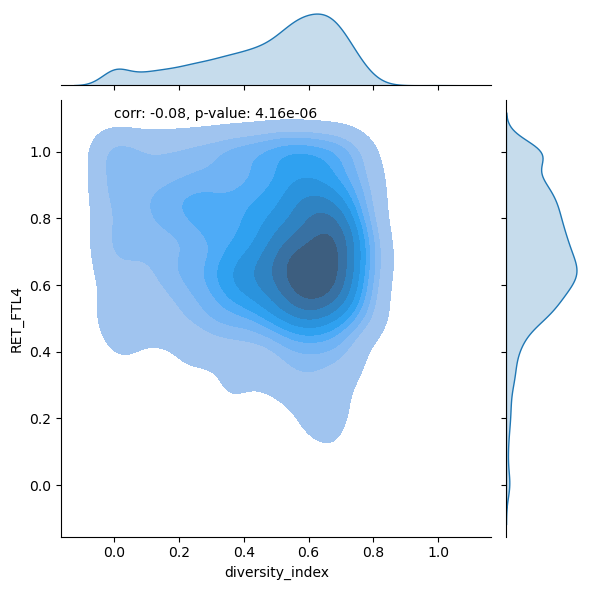
The p-value is very small. This means that we can conclude that there is a relationship between retention rate and diversity index at less-than-four-year institutions. The correlation between diversity index and retention rate is negative. Therefore, we can conclude that as diversity index increases, the retention rate for less-than-four-year institution decreases.
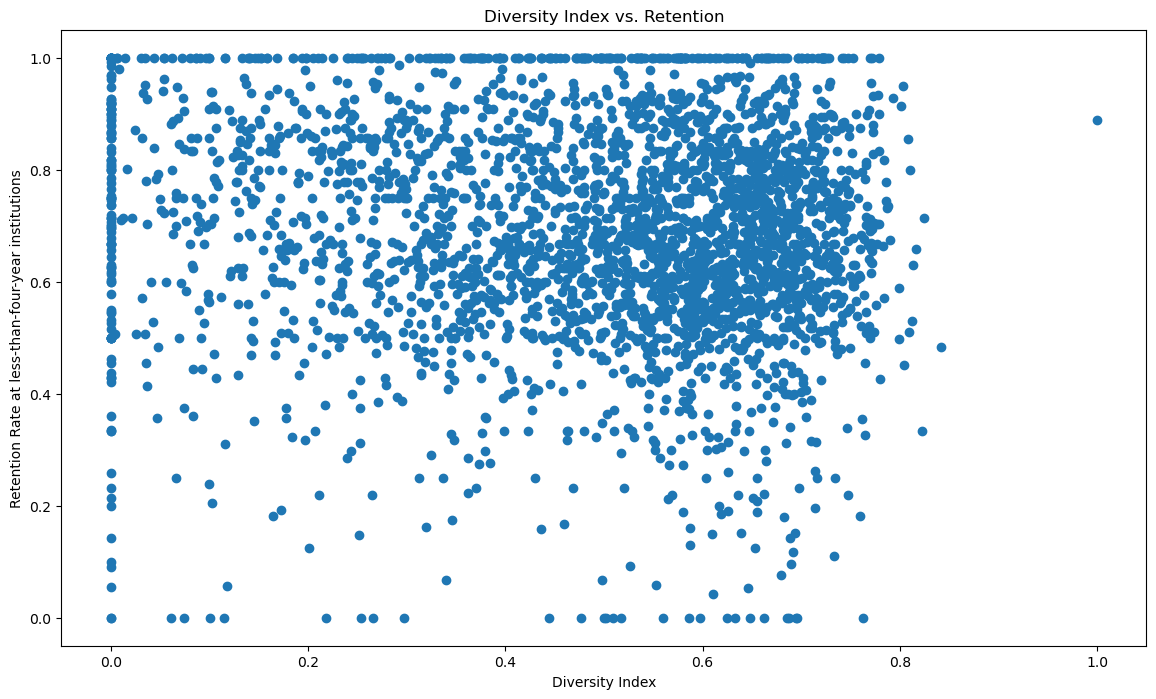
plt.scatter(FTL4_institutions.diversity_index, FTL4_institutions.RET_FTL4)
plt.xlabel("Diversity Index")
plt.ylabel("Retention Rate at less-than-four-year institutions")
plt.title("Diversity Index vs. Retention")
plt.savefig("figures/Diversity_Real_Retention.png")
regression_analysis_results(FTL4_institutions.RET_FTL4, prediction_analysis(FTL4_institutions), 'Diversity_actual_vs_Diversity_predicted.png')
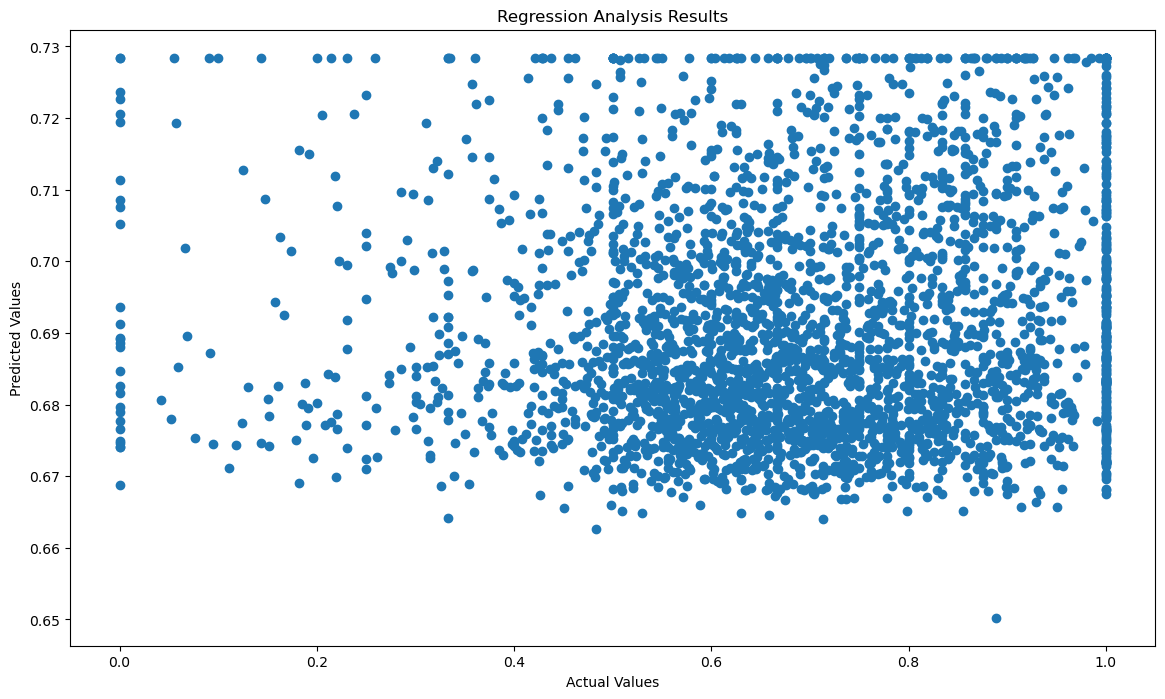
0.006822246291913636
Based on the R^2 value, there does not seem to be a stable prediction of retention values based on diversity index. The R^2 value appears to be too low in order to conclude that there is predictive power.
calculate_MSE(FTL4_institutions.RET_FTL4, prediction_analysis(FTL4_institutions))
0.03870332834271446
However, the MSE value signifies that there is not much error in the predicted values vs the actual values for retention rates.