
Explore Control of the school#
import matplotlib.pyplot as plt
import numpy as np
import seaborn as sns
import pandas as pd
import scipy.stats as stats
from sklearn.linear_model import LinearRegression
from sklearn.metrics import r2_score

from tools.utils import combine_columns, compute_feature_importance, standard_units
data = pd.read_csv("data/Most-Recent-Cohorts-Institution-filtered.csv").drop('Unnamed: 0', axis=1)
Public Schools#
public = data.loc[data["CONTROL"] == 1]

fig, (ax1, ax2) = plt.subplots(1, 2)
fig.suptitle('Public Institution Retention Rates')

ax1.set_title('Retention Rate at 4-year institutions')
ax1.hist(public.RET_FT4, density = True, color = "salmon")

ax2.set_title('Retention Rate at less than 4-year institutions')
ax2.hist(public.RET_FTL4, density = True, color = "salmon")

plt.savefig('figures/retention_public.png');
plt.show()
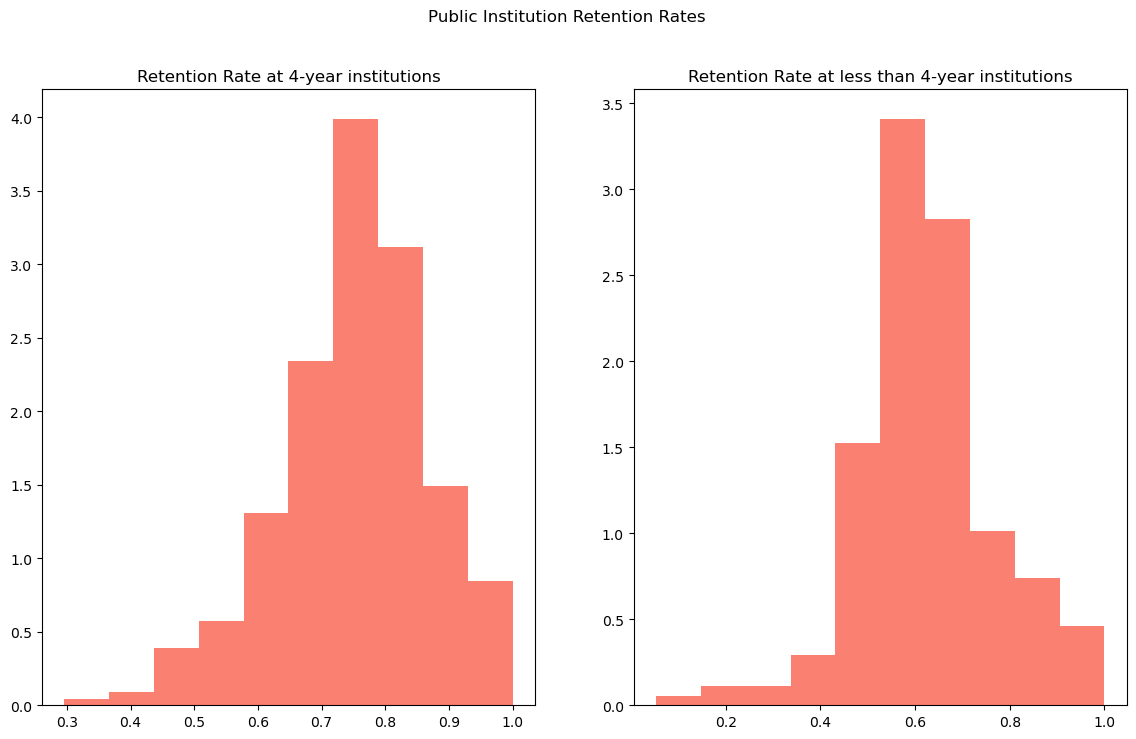
For public schools, the retention rates severely declines as the left-skewed distribution transforms into a normal distribution. The change is more noticeable in the retention rates of less than 4-year public institutions.
Private Non-Profit#
private_non_profit = data.loc[data["CONTROL"] == 2]

fig, (ax1, ax2) = plt.subplots(1, 2)
fig.suptitle('Private (Non-profit) Institution Retention Rates')

ax1.set_title('Retention Rate at 4-year institutions')
ax1.hist(private_non_profit.RET_FT4, density = True, color = "dimgray")

ax2.set_title('Retention Rate at less than 4-year institutions')
ax2.hist(private_non_profit.RET_FTL4, density = True, color = "dimgray")

plt.savefig('figures/retention_private_non_profit.png')
plt.show()
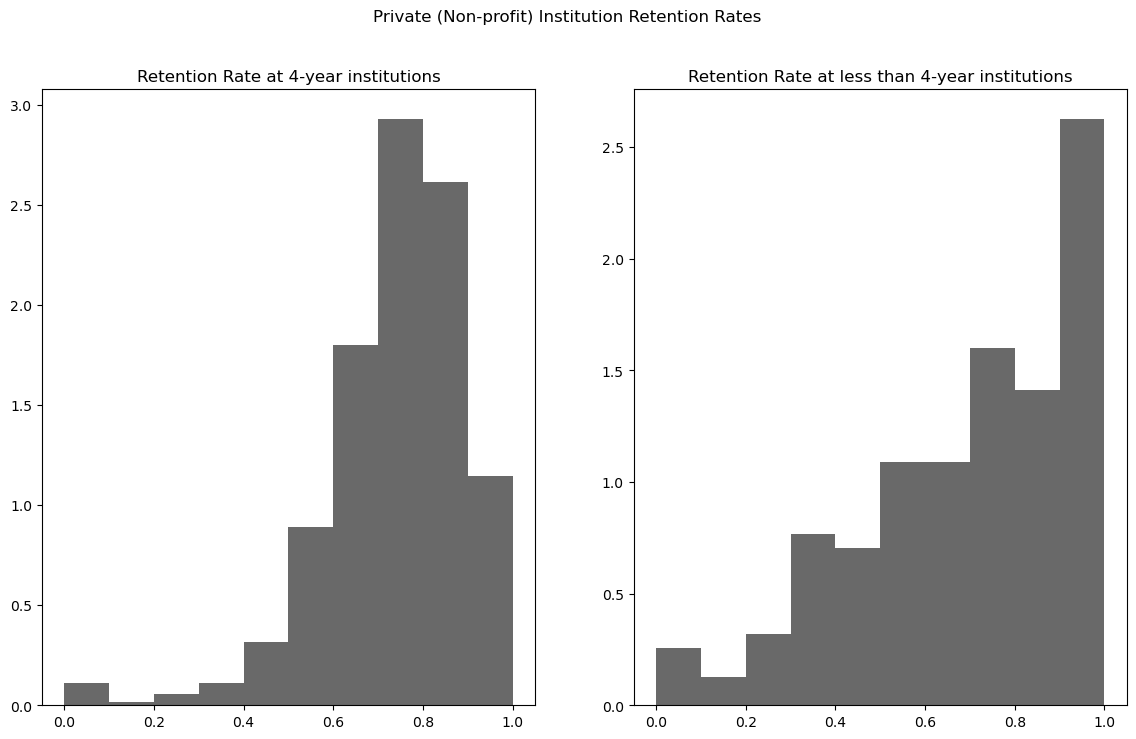
In the case of non-profit private institutions, the retention rates for 4-year institutions appears to remain with the same. However, the retention for less than 4-year institution increases with the density focused in the 100% retention rate.
Private For-Profit#
private_profit = data.loc[data["CONTROL"] == 3]

fig, (ax1, ax2) = plt.subplots(1, 2)
fig.suptitle('Private (For Profit) Institution Retention Rates')

ax1.set_title('Retention Rate at 4-year institutions')
ax1.hist(private_profit.RET_FT4, density = True, color = "darkgray")

ax2.set_title('Retention Rate at less than 4-year institutions')
ax2.hist(private_profit.RET_FTL4, density = True, color = "darkgray")

plt.savefig('figures/retention_private_profit.png')
plt.show()
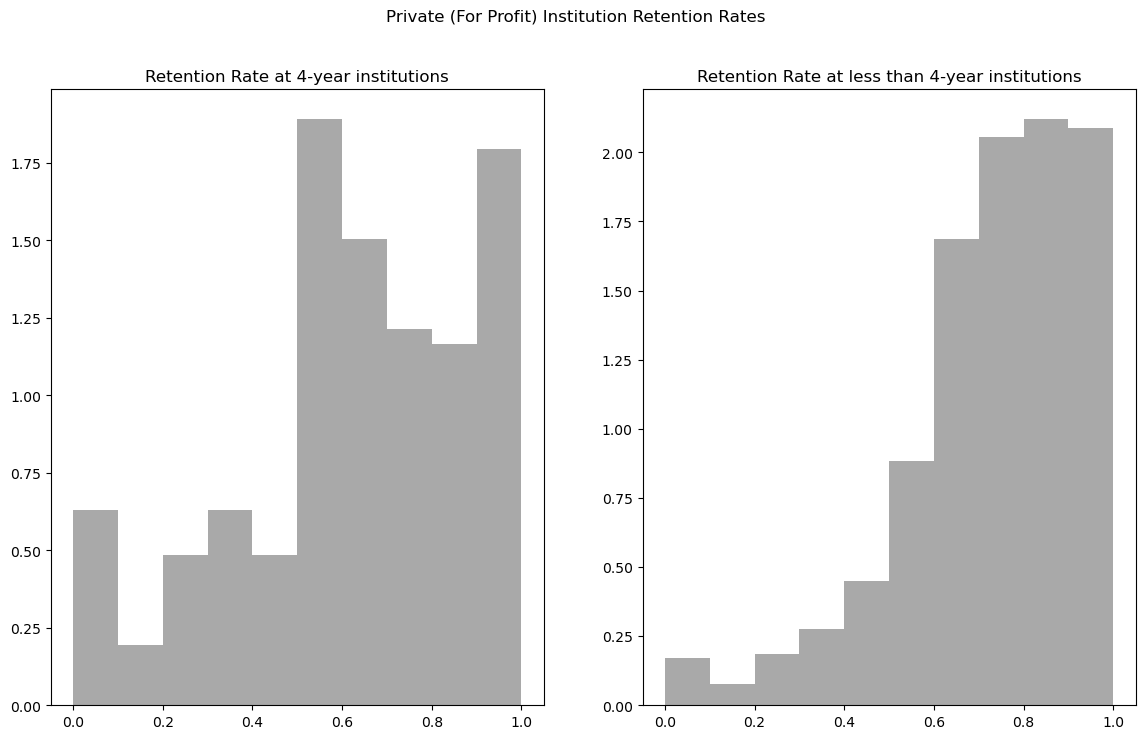
As for-profit private institutions, the retention rate for 4-year institutions maintains a left skewed distribution. However, a spike appears around the the 50% mark which indicates a slightly worse retention than the overall. As for the less than 4-year institution, the retention increases similarly to the non-profit institution as the density is focused on the higher end of the retention rates.