
Explore Percentage of individuals receiving federal loans#
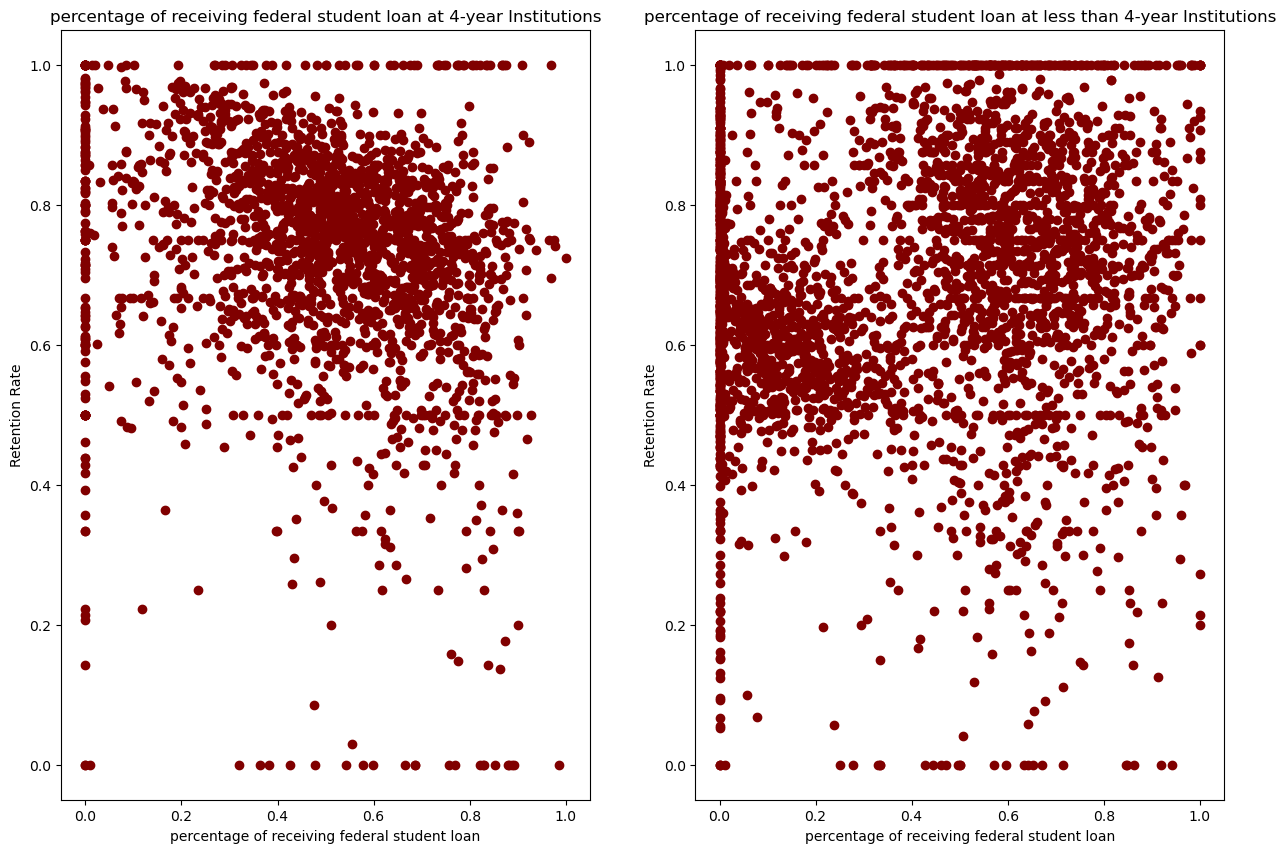
Now we will focus on if the percent of all undergraduate students receiving federal student loan affect the the “First-time, full-time student retention rate at four-year institutions” and “First-time, full-time student retention rate at less-than-four-year institutions”. We can filter out the related data.
import matplotlib.pyplot as plt
import numpy as np
import seaborn as sns
import pandas as pd
import scipy.stats as stats
from sklearn.linear_model import LinearRegression
from sklearn.metrics import r2_score

from tools.utils import combine_columns, compute_feature_importance, standard_units
data = pd.read_csv("data/Most-Recent-Cohorts-Institution-filtered.csv").drop('Unnamed: 0', axis=1)
tuition_data = data[['RET_FT4', 'RET_FTL4', 'TUITIONFEE_IN','TUITIONFEE_OUT']]
# data only with tuition fee of in state and out state, four-year institutions and less than four-year institutions
percent_loan_data = data[['RET_FT4', 'RET_FTL4', 'PCTFLOAN']]
percent_loan_data.head()
| RET_FT4 | RET_FTL4 | PCTFLOAN | |
|---|---|---|---|
| 0 | 0.5403 | NaN | 0.7504 |
| 1 | 0.8640 | NaN | 0.4688 |
| 2 | 0.5000 | NaN | 0.8493 |
| 3 | 0.8180 | NaN | 0.3855 |
| 4 | 0.6202 | NaN | 0.7805 |
fig, (ax1, ax2) = plt.subplots(1, 2,figsize=(15,10))
fig.suptitle('')

ax1.set_title('percentage of receiving federal student loan at 4-year Institutions')
ax1.set_xlabel('percentage of receiving federal student loan')
ax1.set_ylabel('Retention Rate')
ax1.scatter(percent_loan_data.PCTFLOAN, percent_loan_data.RET_FT4,color ='maroon')

ax2.set_title('percentage of receiving federal student loan at less than 4-year Institutions')
ax2.set_xlabel('percentage of receiving federal student loan')
ax2.set_ylabel('Retention Rate')
ax2.scatter(percent_loan_data.PCTFLOAN, percent_loan_data.RET_FTL4,color ='maroon')

plt.savefig('figures/retention_percentage_federal_loan.png')
plt.show()
standard_percent_loan_data = tuition_data.assign(standard_RET_FT4=standard_units(percent_loan_data.RET_FT4),
                       standard_RET_FTL4=standard_units(percent_loan_data.RET_FTL4),
                       standard_percent_loan=standard_units(percent_loan_data.PCTFLOAN))
standard_percent_loan_data
# the correlation coefficient(r) of percentage of receiving federal student loan at 4-year Institutions
r_percent_loan_4year = np.mean(standard_percent_loan_data.standard_RET_FT4 * standard_percent_loan_data.standard_percent_loan)
print("The correlation coefficient of percentage of receiving federal student loan at 4-year Institutions is "+ str(r_percent_loan_4year))
# the correlation coefficient(r) of percentage of receiving federal student loan at less than 4-year Institutions
r_percent_loan_l4year = np.mean(standard_percent_loan_data.standard_RET_FTL4 * standard_percent_loan_data.standard_percent_loan)
print("The correlation coefficient of percentage of receiving federal student loan at less than 4-year Institutions is "+str(r_percent_loan_l4year))
The correlation coefficient of percentage of receiving federal student loan at 4-year Institutions is -0.1654776936242682
The correlation coefficient of percentage of receiving federal student loan at less than 4-year Institutions is 0.14346890122719802
By the scatter above and the correlation coefficient,we think the percentage of receiving federal student loan at 4-year Institutions and less than 4-year Institutions graph looks like not really match the positive or negative relationship with retention rate. Therefore, we think the percentage of receiving federal student loan at 4-year or less than 4-year Institutions not really influence student’s retention rate.