EDA and Data Cleaning#
import numpy as np
import pandas as pd
from matplotlib import pyplot as plt
from sklearn.decomposition import PCA
from sklearn.preprocessing import StandardScaler
Data from https://www.kaggle.com/datasets/fedesoriano/heart-failure-prediction#
# Import raw data
raw_data = pd.read_csv('../data/heart.csv')
raw_data.head()
| Age | Sex | ChestPainType | RestingBP | Cholesterol | FastingBS | RestingECG | MaxHR | ExerciseAngina | Oldpeak | ST_Slope | HeartDisease | |
|---|---|---|---|---|---|---|---|---|---|---|---|---|
| 0 | 40 | M | ATA | 140 | 289 | 0 | Normal | 172 | N | 0.0 | Up | 0 |
| 1 | 49 | F | NAP | 160 | 180 | 0 | Normal | 156 | N | 1.0 | Flat | 1 |
| 2 | 37 | M | ATA | 130 | 283 | 0 | ST | 98 | N | 0.0 | Up | 0 |
| 3 | 48 | F | ASY | 138 | 214 | 0 | Normal | 108 | Y | 1.5 | Flat | 1 |
| 4 | 54 | M | NAP | 150 | 195 | 0 | Normal | 122 | N | 0.0 | Up | 0 |
Check for NaN values in columns#
nan_count = raw_data.isna().sum()
print(nan_count)
Age               0
Sex               0
ChestPainType     0
RestingBP         0
Cholesterol       0
FastingBS         0
RestingECG        0
MaxHR             0
ExerciseAngina    0
Oldpeak           0
ST_Slope          0
HeartDisease      0
dtype: int64
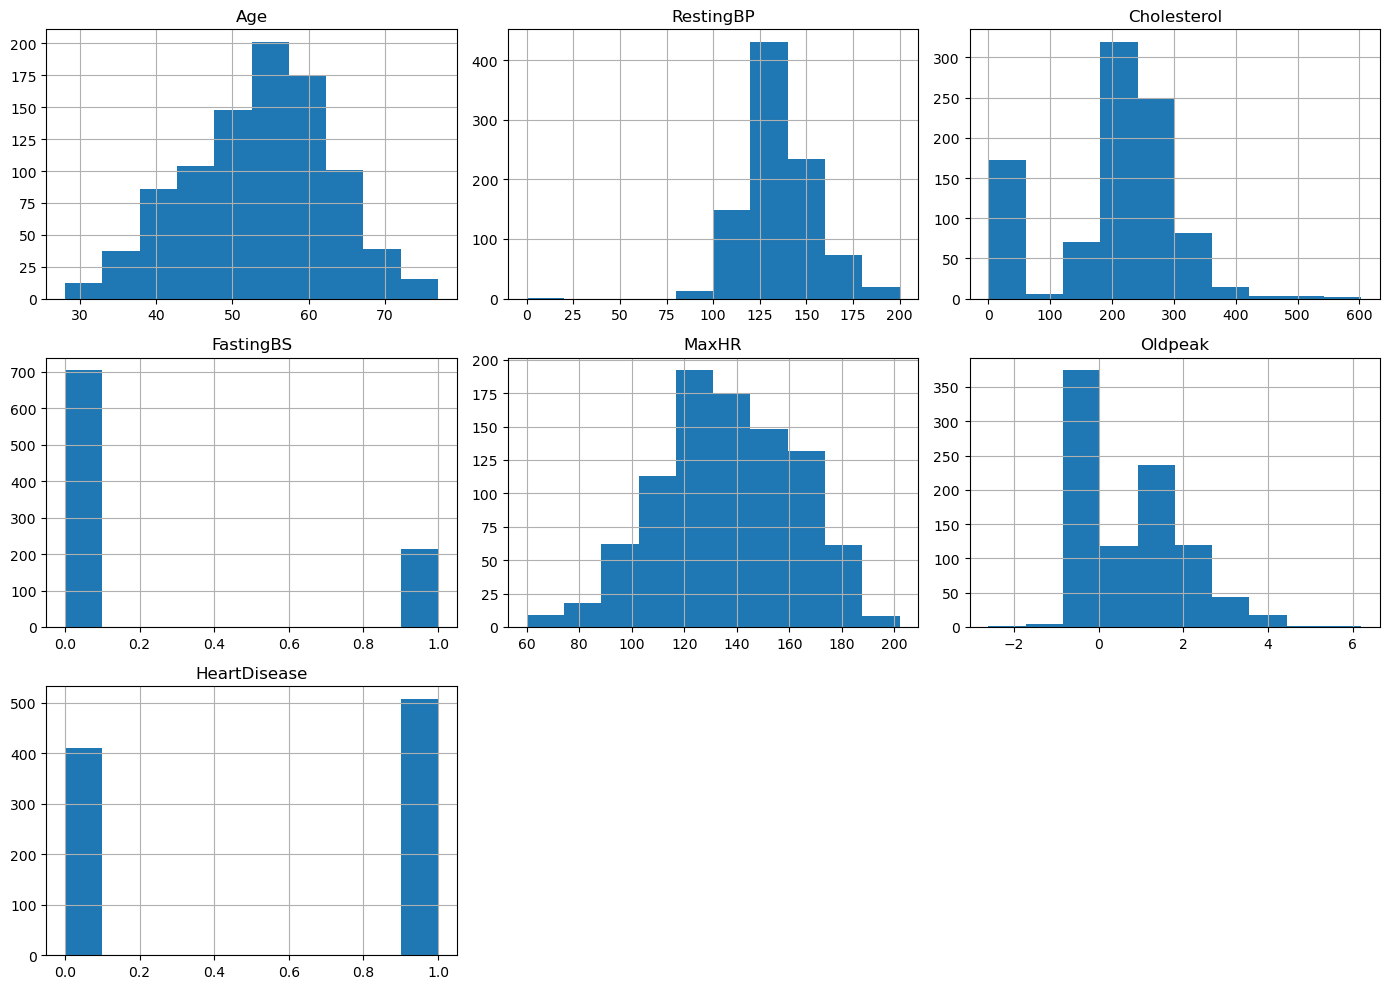
raw_data.hist(figsize=(14, 10))
plt.tight_layout()
plt.savefig('../figures/eda_histograms.png')

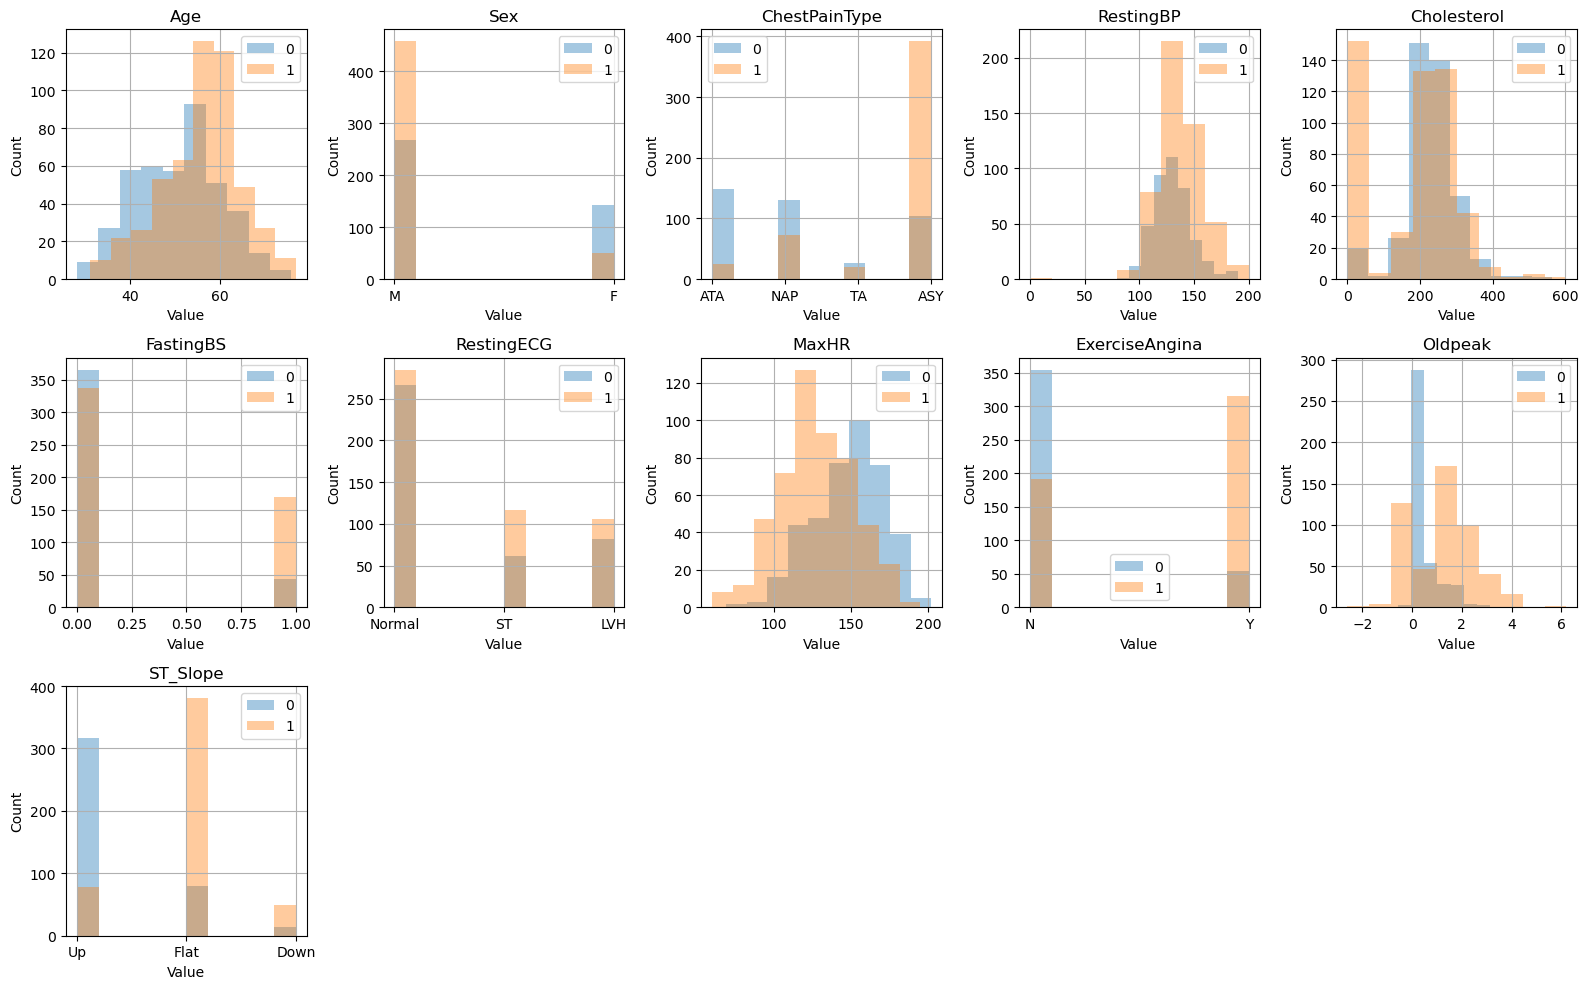
Looking at class distributions#
fig,axes = plt.subplots(nrows=3,ncols=5,figsize=(16,10))

# loop through each column in the dataframe
for i, col in enumerate(raw_data.columns[:-1]):
    # select the appropriate subplot axis based on the index i
    ax = axes[i // 5, i % 5]
    # plot a histogram of the column for each group in 'HeartDisease'
    raw_data.groupby('HeartDisease')[col].hist(alpha=0.4, ax=ax)
    # set the title, y-axis label, and x-axis label for the subplot
    ax.set_title(col)
    ax.set_ylabel("Count")
    ax.set_xlabel("Value")
    ax.legend(raw_data['HeartDisease'])

fig.delaxes(axes[2][1])
fig.delaxes(axes[2][2])
fig.delaxes(axes[2][3])
fig.delaxes(axes[2][4])
# adjust the spacing between the subplots for better readability
plt.tight_layout()
plt.savefig('../figures/eda_class_distributions.png')

PCA#
categorical_columns= ['Sex', 'ChestPainType','RestingECG', 'ExerciseAngina', 'ST_Slope' ]
X = raw_data.drop(columns=categorical_columns)
y = raw_data['HeartDisease']
scaler = StandardScaler()
X_standardized = scaler.fit_transform(X)
# Using PCA
pca = PCA(n_components = 7)
pca.fit(X_standardized)
PCA(n_components=7)In a Jupyter environment, please rerun this cell to show the HTML representation or trust the notebook.
On GitHub, the HTML representation is unable to render, please try loading this page with nbviewer.org.
PCA(n_components=7)
p_c = pca.fit_transform(X_standardized)
# print(principalComponents)

principal_df = pd.DataFrame(data=p_c, columns = ['PC1','PC2','PC3','PC4','PC5','PC6','PC7'])

final_df = pd.concat([principal_df, y],axis=1)
final_df.head()
| PC1 | PC2 | PC3 | PC4 | PC5 | PC6 | PC7 | HeartDisease | |
|---|---|---|---|---|---|---|---|---|
| 0 | -2.417053 | -0.508044 | -0.536672 | 0.492483 | -0.592140 | 0.263087 | 0.035454 | 0 |
| 1 | 0.138073 | -0.813523 | -0.245526 | 0.495047 | -1.577625 | -0.012082 | 0.836385 | 1 |
| 2 | -1.346575 | 0.120716 | 0.050249 | -1.194085 | -0.405928 | 1.707199 | -1.379748 | 0 |
| 3 | 0.768445 | -0.416296 | 0.876559 | -0.468257 | -0.780828 | 0.872467 | -0.231420 | 1 |
| 4 | -0.519631 | -0.324544 | -1.160150 | -1.158588 | -0.430199 | 0.032315 | -0.483574 | 0 |
# Plot
fig = plt.figure(figsize = (8,8))
ax = fig.add_subplot(1,1,1)
ax.set_xlabel('Principal Component 1', fontsize = 15)
ax.set_ylabel('Principal Component 2', fontsize = 15)
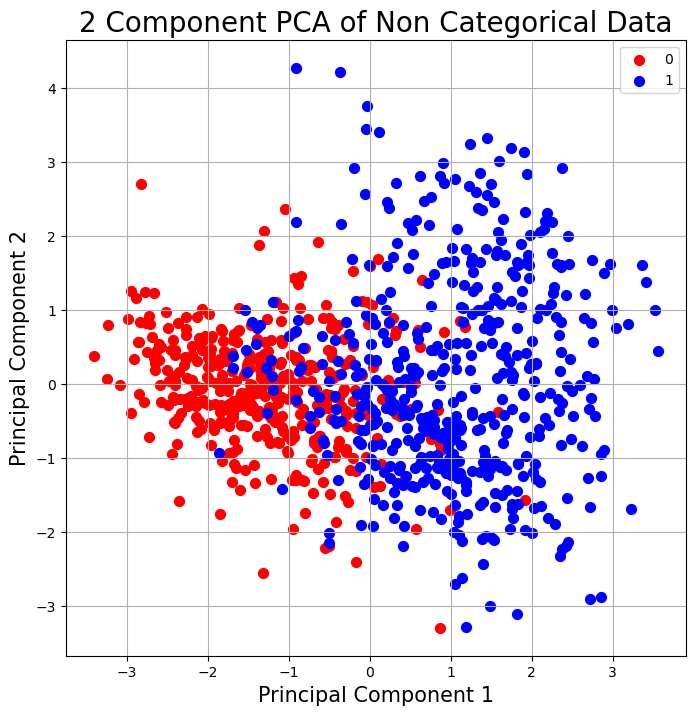
ax.set_title('2 Component PCA of Non Categorical Data', fontsize = 20)
targets = [0,1]
colors = ['r', 'b']
for target, color in zip(targets,colors):
    indicesToKeep = final_df['HeartDisease'] == target
    ax.scatter(final_df.loc[indicesToKeep, 'PC1']
               , final_df.loc[indicesToKeep, 'PC2']
               , c = color
               , s = 50)
ax.legend(targets)
ax.grid()
plt.savefig('../figures/2_component_pca.png')

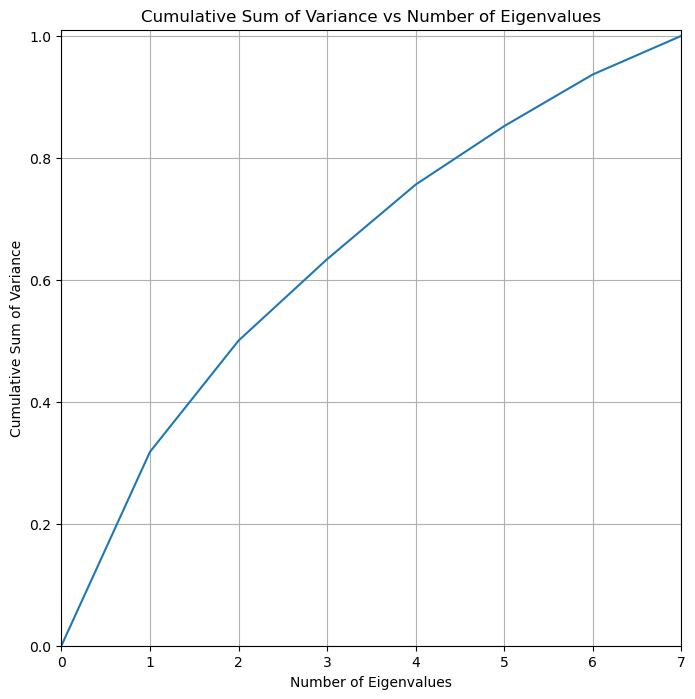
## Variability of components
cum_var = pca.explained_variance_ratio_.cumsum()
cum_var=np.insert(cum_var,0,0)
k_features = list(range(0,X.shape[1]+1))

# Plot figure
fig = plt.figure(figsize=(8, 8))
ax = fig.add_subplot(1,1,1)
ax.plot(k_features,cum_var)
# plt.rc('axes', titlesize=14)
# plt.rc('axes', labelsize=12)
ax.set_xlabel("Number of Eigenvalues")
ax.set_ylabel("Cumulative Sum of Variance")
ax.set_title("Cumulative Sum of Variance vs Number of Eigenvalues")
ax.set_xlim([0,7])
ax.set_ylim([0,1.01])
ax.grid()
plt.savefig('../figures/sum_of_variance.png')

